
Basis for a recommendation
Analysis of a superannuation fund delivers a quantifiable assessment of how good or bad the fund is based on performance, price, features, benefits and size. If we identify a better path forward for a client, that we believe is likely to improve wealth over time, provide for a better retired life, we believe this advice should be delivered. To do this correctly we adhere to best interest duties and obligations detailed by ASIC in the FOFA reforms.
Super fund review requirements
Identification of your existing super fund asset allocation allows RSA to identify the super category your are in. We use your current account balance and the asset allocation that we calculate based on information provided to compare your super fund to similar super funds. This is defined by super category. The categories you may be familiar with are conservative, balanced, balanced growth, high growth, Australian Shares and the like. Each category represents a universe of super funds with similar asset allocation ranges. Super fund categories are generally linked to an index.
The review of your fund compares it to the universe of super funds we have in our database, there are over 1000 funds. below is a sample of information continually analysed for funds and updated.
Performance, fee and volatility review

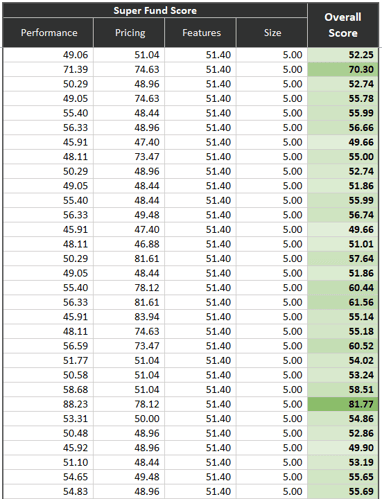
Scoring each super fund
Funds analysed are rated using our super fund scoring methodology
An 'optimisation' is applied to identify the 'best' fit super fund for you. When this is complete the following information is made available to you (sample only):
Super review results
| OVERALL SCORE ANALYSIS | Your fund has an overall score of 43, the best in category, provided an overall score of 91.35. |
| 5 YEAR PERFORMANCE ANALYSIS | Based on historical performance only, after 5 years your fund would have earned $531,097. The best in category would have earned $884,304 the difference being $353,207. |
| 10 YEAR PERFORMANCE ANALYSIS | Based on historical performance only, after 10 years your fund would have earned $764,767. The best in category would have earned 1,911,720, the difference being $1,146,952 |
| INVESTMENT COST ANALYSIS | Your investments indirect cost ratio is 1.14%, the category average is 1.52%, the best in category is 1.23%. |
| INVESTMENT OPTIONS ANALYSIS | Your super fund has 132 investments options to choose from. The best in category has 839 investment options to choose from. |
| FEATURES ANALYSIS | Your super funds investment features scores is 51.4. The best in category has a features score of 78.36. |